Visualization of Dataflow Blocks

I have LINQPad's sample Dataflow query which makes the output window switch to graphical and visualizes the activity within the block. I have adapted my own query but it refuses to render graphically and just displays BufferBlock``1 Id=665. Is there some trick to getting the graphical rendering?
Answers
-
My query.
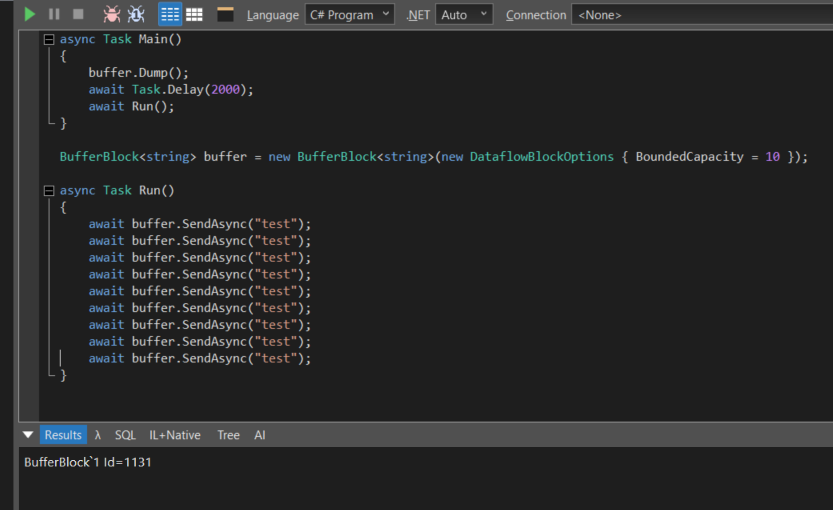
-
Can you please post your sample as text?
-
Sure. (Renamed to .txt for upload) Thanks for taking the time to investigate. I'm running 8.9.5 Premium (x64)
-
So, by removing the Nuget reference and leaving the namespace imports, it works.
-
This makes sense. By adding the NuGet reference, you're using a different version of Dataflow, which will result in a type mismatch with LINQPad's visualizer.
