Chart always returning Null (inc samples)

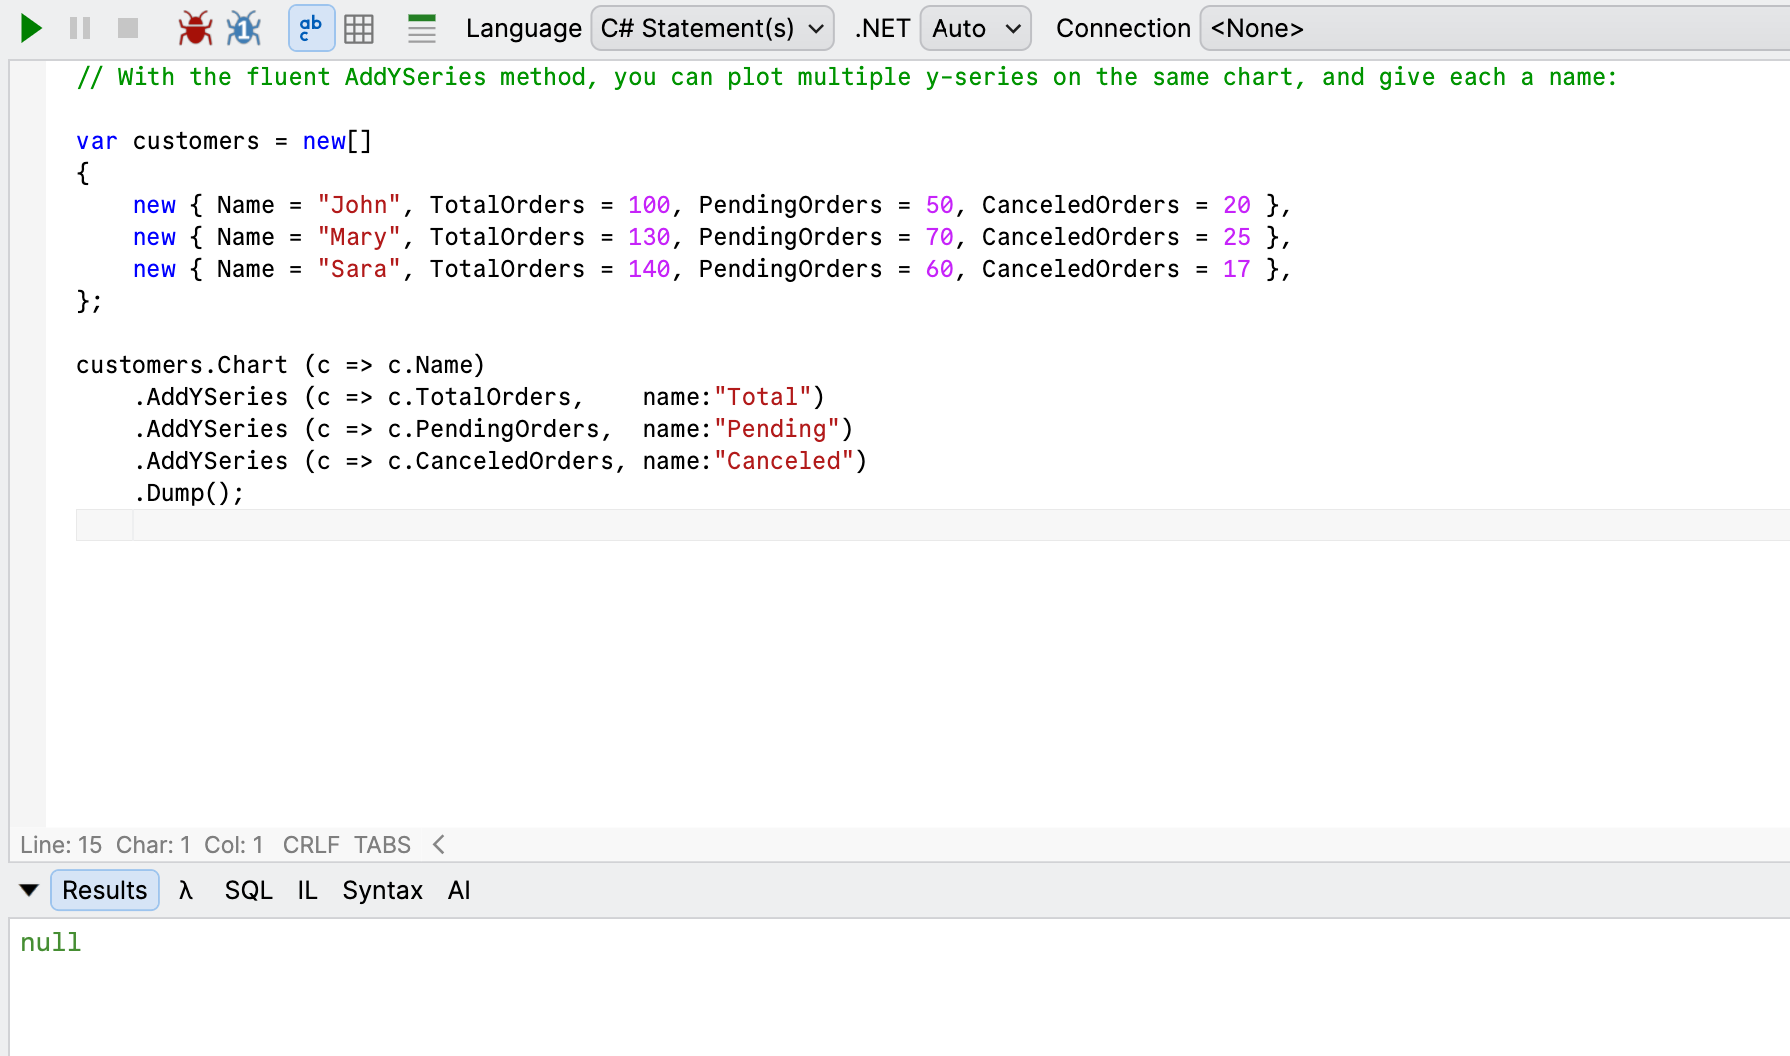
I'm trying to chart some data, however the result will always be null.
I've attached an image of a unedited sample which has the same problem.
Is there something I'm missing or misconfigured?
Tested with dotnet 6, 8, 9.
Running 9.2.5 Beta (ARM)
Best Answer
-
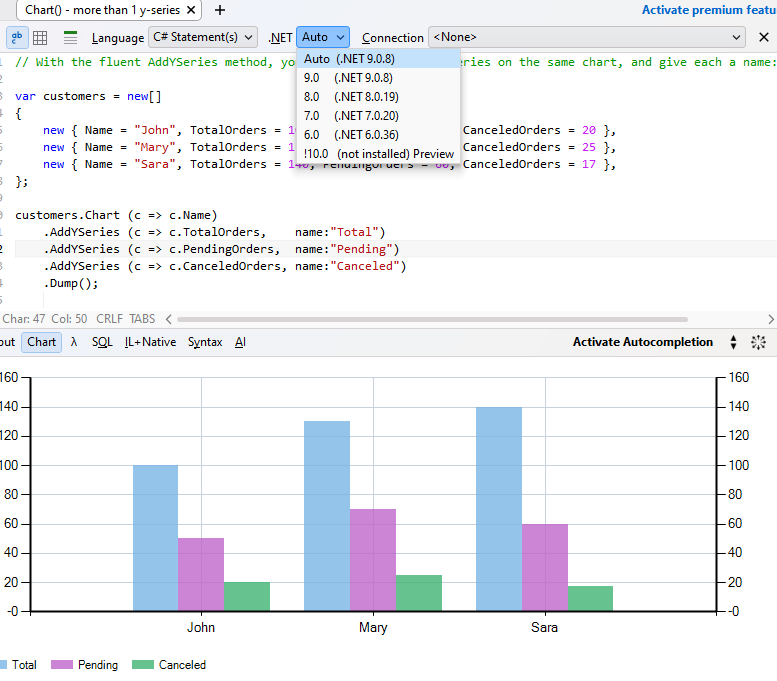
See https://forum.linqpad.net/discussion/3403/linqpad-9-early-preview-now-available/p2#Comment_9263 and also Joe's reply in the next message.

Answers
-
Could you please include code as a text?
-
It's nothing more than the sample code that comes with Linqpad, unedited.
-
Win 10, LINQPad Beta 9.2.6, x86/x64, .NET 6-9
-
I'm aware it's supposed to work, there's no other posts about having this issue.
I'm on OSX 15.6 -
Thank you, that's the answer
")
I wasn't sure if Graphs were supported on OSX, but didn't see it mentioned on the feature/download pages.
