Chart Not Displaying Correctly on macOS

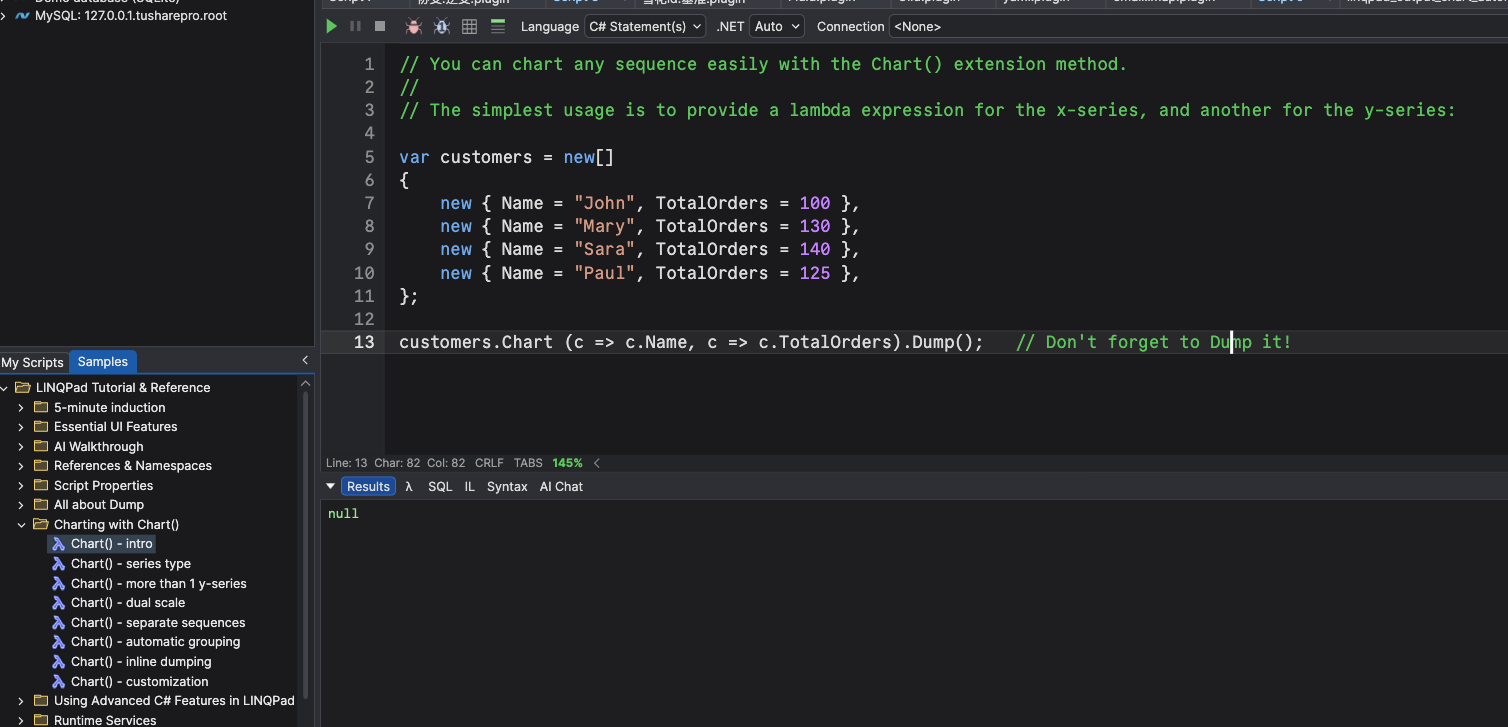
I am following LINQPad Tutorial & Reference > Charting with Chart() > Chart() – intro.
The sample code runs without errors, but when executing it on macOS, the Results window returns null, and no chart is displayed.
Could you please advise whether this is related to:
• a specific setting,
• a macOS limitation, or
• a LINQPad version / runtime compatibility issue?
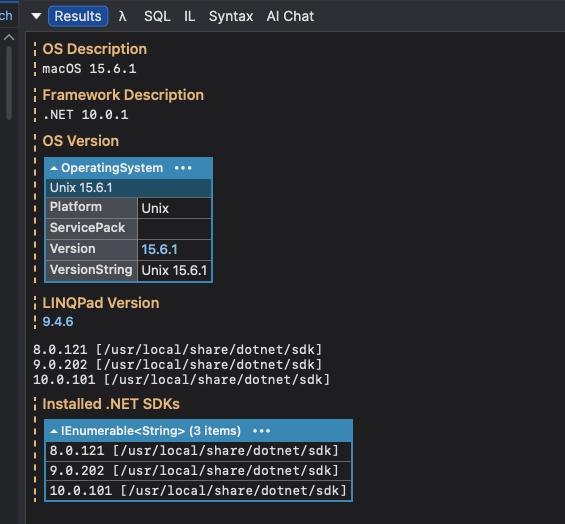
For reference, my system environment is: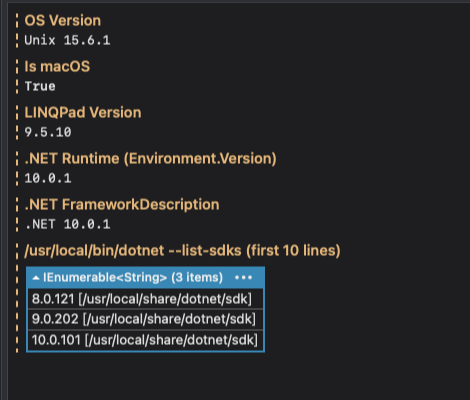
Any guidance would be appreciated.
Comments
-
I’m experiencing the same issue in my version as well.
-
This feature hasn't yet been implemented on macOS. The Windows version relies on a WinForms component which isn't available on macOS. I'm still researching the options for an alternative that can provide the same functionality.
-
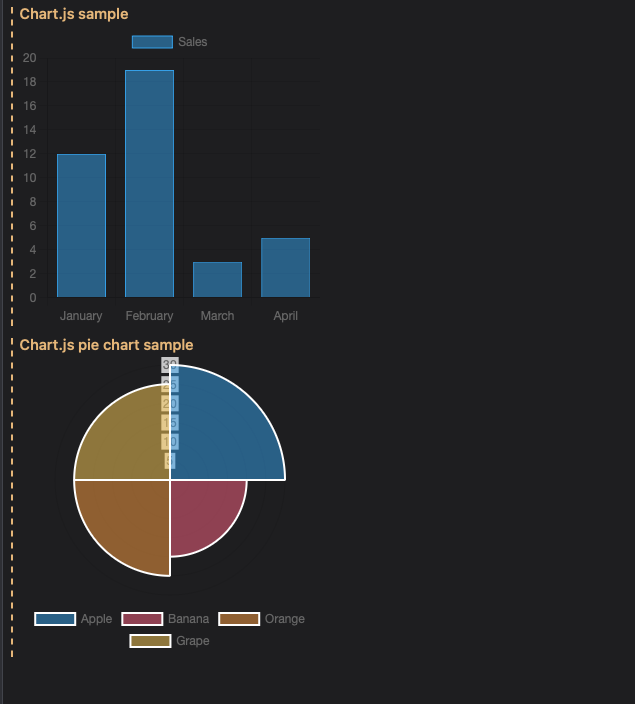
Ok thank you, I will use chartjs instead first.
-
it works for me
-
Nice!
-
This is a fantastic update! Bringing Util.Chart to macOS was long overdue, and choosing Apache ECharts.js as the rendering backend was a brilliant call — it's one of the most capable and battle-tested charting libraries out there.
But the real showstopper is the new EChart control. Dynamic updates, full interactivity, and SVG export in a single control? That's not just a feature addition — that's a game changer for anyone building data-rich scripts in LINQPad. The ability to drop down to the raw ECharts.js schema while still having a clean C# wrapper strikes the perfect balance between power and convenience.
Seriously impressive work. The LINQPad team keeps raising the bar. 🎉
-
Thanks for your support!