DumpContainer.Refresh() memory leak in connection with arrays of reference types (LINQPad8+)

I've encountered a massive memory leak in LINQPad 8 and 9 in connection with dumping arrays of reference types into a DumpContainer and then repeatedly calling Refresh() on it. This makes LINQPad exhaust even 32 GB or 64 GB of RAM in mere minutes but my script needs to run for a couple of hours.
Note: the problem does not occur in LINQPad 5, only in versions 8 and 9 (both Windows and MacOS). In LINQPad 7 the query process is not affected but the associated msedgewebview2.exe process eats gigabytes like there's no tomorrow (which I didn't notice at first because it was listed under the process group for a LINQPad 7 beta, not under the process group for the LINQPad 7 instance itself).
A minimal example for reproducing the effect can be derived from the code given in memory leak when dumping exceptions by CodesInChaos with a small change to the DumpContainer constructor argument:
- var dump = new DumpContainer(state).Dump();
+ var dump = new DumpContainer(new [] { state }).Dump();
This gives:
void Main ()
{
    var state = new State { Ex = new Exception() };
    var dump = new DumpContainer(new [] { state }).Dump();

    for (var i = 0; ; i++)
    {
        state.Counter = i;
        dump.Refresh();
    }
}

class State
{
    public int Counter;
    public Exception Ex;
}
(Note: I removed the loop condition because it does not serve any purpose here)
Here is an alternative version that is closer to my use case and which eats memory much more rapidly:
void Main ()
{
    var content = Enumerable.Range(0, 1000)
        .Select(i => new StatsLine(i))
        .ToArray();
    var dump_container = new DumpContainer(content).Dump();

    for (var i = 0; ; ++i)
    {
        content[0].A = i;
        dump_container.Refresh();
    }
}

class StatsLine
{
    public int A, B, C, D, E, F;

    public StatsLine (int i)
    {
        A = B = C = D = E = F = i;
    }
}
Is there a way to shed the excess memory via some trick or other? I've tried calling DumpContainer.ClearContent() or Util.ClearResults() but to no avail.
I've attached the script I'm working on as illustration for where this is coming from; I was trying to make a simple UI for a script that sends millions of API requests to a herd of slave computers, with different degrees of parallelism for each slave. Depending on network weather and other factors I need to tweak the DOP for individuals slaves on the fly in order to maximise overall throughput, hence the detailed statistics.
This script also shows the effect of the foreground process boost under Windows. The framerate goes up by about 25% when LINQPad is in the foreground and it goes down again when another process gets the focus.
Best Answer
-
Try the latest LINQPad 9 beta (9.10.12) - this should fix the memory leak inside LINQPad.
The msedgewebview2 issue is not a leak - it's the Chromium engine being lazy with GC. I've also included a workaround for this, so that process memory footprint should improve now, too.

Answers
-
Update: LINQPad 6 and 7 can be tamed by switching to the older, IE-based rendering engine. No such luck with LINQPad 8 and 9, though, since there the query process itself leaks memory as well, not only the
msedgewebview2.exeprocess.I also learned another useful thing during this investigation: cancelling the query process does not free any memory hogged by its
msedgewebview2.execompanion. That goes away only when the correspoding tab (or the whole LINQPad instance) is closed. -
Thanks for the detailed info. I've got a repro and am onto it.
-
Thank you for taking the time to look into this.
I've kept my test script running in LINQPad 5, 6 and 7 (the latter two with the legacy rendering engine) since I posted the original message - some twenty-odd hours - and they have performed flawlessly. No memory leaks, no clogged exhaust pipes, nothing, after over a million-plus UI updates (and a billion-plus internal statistics updates).
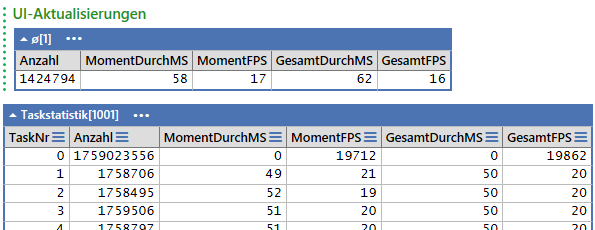
Sidenote: the foreground process boost affects a program even if it is running at
REALTIME_PRIORITY_CLASS. With the test script in the foreground frame time hovered around 58 ms, rising quickly to 80ish values when another process was in the foreground, over 90 ms with LINQPad minimised, and less than 50 ms when in the foreground with the screen saver active (i.e. screen turned off). All that atREALTIME_PRIORITY_CLASS. So much for predictable performance under Windows 11 ... Microsoft seems to be cheating left and right here in order to get the appearance of snappy performance on one hand and good battery life (or reduced energy consumption) on the other. Of course, with all the garbage processes that the OS starts itself - directly or via the task scheduler - they pretty much have to assume that all background activity must be expendable, or they would get nowhere. -
@JoeAlbahari said:
Try the latest LINQPad 9 beta (9.10.12) - this should fix the memory leak inside LINQPad.Thanks, it works like a charm. I had it run for roughly the same time as the other LINQPads and it was rock-solid, not even the slightest hint of memory gluttony.
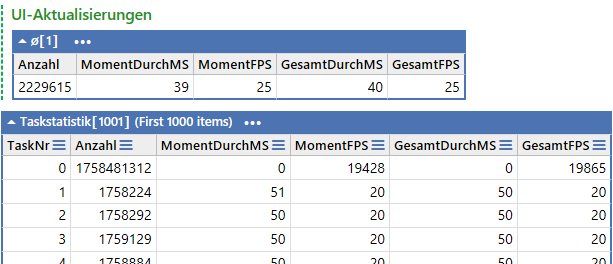
It is interesting to see how much faster the UI updates are compared to the older LINQPads with their older .NET versions.